9. Creating the Knowledge Box for Search (Causal Discovery)
To search the above dataset(s), configure Tetrad as follows:
- Insert a Data box and load in the 175-variable dataset identified above.
- Insert a Knowledge box and connect the Data box to the Knowledge box, which makes all 175 variable names available to the Knowledge box. (More about what to do with the knowledge box in a moment. And don’t forget you can refer to the materials hyperlinked above for how to insert the data box and search box and indeed for subsequent operations in the GUI.)
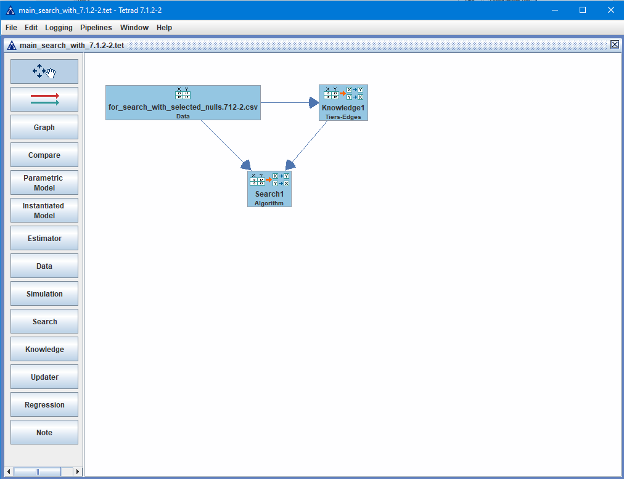
- Insert a Search box and connect both the Data box and Knowledge box to the Search box (creating a triangle of edges linking the three boxes).
- Here’s a screenshot of the main search Tetrad session showing the Data box on top left, the Knowledge box to its right, and the Search box below both with arrows from the Data box to the Knowledge box and Search box; and from the Knowledge box to the Search box. Using the context menu on the Data box, the Data box name was changed to reflect the name of the CSV file read in (which is what made the Data box so wide):

A Knowledge Box typically specifies which direct causal relationships are not allowed. For example, if two variables represent events at different points in time, we would not expect a variable representing the later event to have a direct causal relationship oriented into a variable representing the event earlier in time: the edge between the two should not be oriented from later count into an earlier count. And we can specify such constraints in what Tetrad GUI calls a Knowledge Box, which is then used to constrain orientation of edges during search. Knowledge boxes can present such constraints in layers (called “tiers”). Many of the variables in a dataset can be assigned to different tiers with the understanding that a variable in a later (higher-numbered) tier cannot have an edge going into a variable in an earlier (lower-numbered) tier. The variables in the dataset that are not assigned to a tier are not so constrained. With respect to the dataset that we just created, there is only one such type of constraint: variables representing what happened in the next time period (there are 9 such) cannot have a direct causal relationship into any variable in the current time period (there are 9 such) nor into “Start”. The other variables: the 42 null variables (nv-) should have no relationship, chronologically, correlational, or causal, with any other variable. While the case is not as strong, we’d generally expect similar for the 114 binarized variables (b_). In such circumstances, it’s best not to assign any of these variables to a tier but allow them to “float” during causal discovery. With that in mind, the appropriate tiering structure for the variables in our dataset is:
- Not in tier: 157 variables in total, including all 42 null variables (i.e., 1 (for “Start”) + 9 (for current time period) + 9 (for next time period) + 23 (22) (active binarized variables)); plus the 1 (non-null) Start variable; plus all 114 binarized (non-null) variables.
- The co-authors debated whether to keep the “Start” variable in the dataset, but it was thought that perhaps its presence would help highlight sociotechnical behaviors’ effects that were maybe more true at the beginning of the overall open-source project time period or at the end (e.g., a causal relationship that was more true 20 years ago vs. something more true today), which might shed some light on whether sociotechnical behaviors and their effects might be changing over the 20 years. But the larger picture of how to treat Start is not so easy to resolve, and so we won’t assign Start to a tier.
- Tier 1: all 9 current time period-based sociotechnical and work-rate variables
- Tier 2: all 9 next time period-based sociotechnical and work-rate variables; clearly these variables cannot cause the similar variables in the current time period.
The co-authors wrestled with this question: within a time period, should the 9 variables be placed in some causal order or their causal relationships be constrained in some way?
- It’s hard to judge what that order should be for these counts and measures of what went on within the same time period and it’s hard to say definitively that whatever one variable measures that is causing whatever a second variable is measuring to vary in some way within the same time period is a one-way relationship and that the first variable doesn’t respond in some way to changes in the second variable within that same time period.
With this caution in mind, here is the Knowledge Box we will be using to constrain certain edge orientations during Causal Discovery (screenshot):

In the above knowledge box above, note the scroll bar in the top panel. The top panel lists the variables “Not in tier,” which is 175-18 or 157 of the variables, which obviously are not all visible in the small area afforded to the panel, but we see the top two rows of these 157 variables, encompassing the first 20 of these variables. If one were to click on the scroll bar to see the other variables, we’d see the other 14 rows of 10 variables each (approximately), which are all binarized variables except for the very first, which is “Start”, and which are sorted in ASCII order. (When you initially open a knowledge box, the variables are not in ASCII order, but briefly selecting a variable within a panel and just “shaking” it a tiny bit so that you haven’t left the panel and then releasing it will result in the variables appearing in ASCII order.)